

August 15th, 2025 - Volume 11 (2025) Missive 118 (Friday)
Charts as far as the missive can see
What retail sales component carries the most weight
Longer-term retail relationships
We like to do this every so often and today is one of those days. Outside of what you are reading here, this missive will be comprised almost entirely of charts and graphs illustrating the overall trends in retail sales. Released this morning, the July data showed a 0.5 percent gain in overall sales which was mostly in line with expectations. However, this is an advanced measure and, as such, is volatile as always. That being said, it is always worthwhile to take a longer-term look at the overall behavior of retail sales, which as a measure of final demand, tends to carry a significant amount of economic insight,
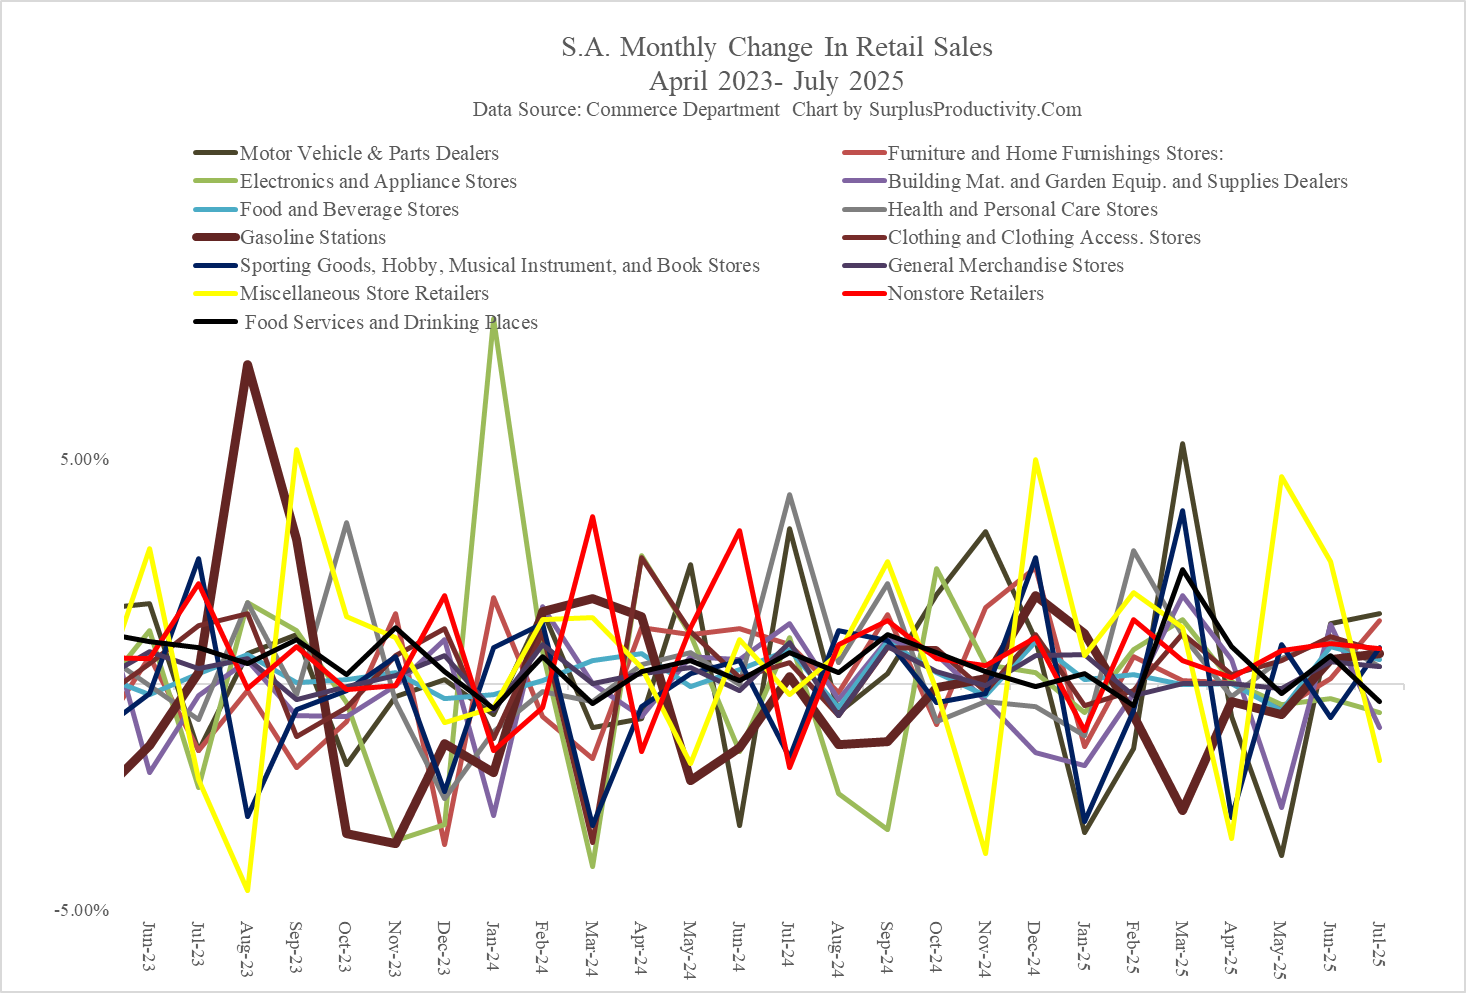
The retail sales data is always volatile given it is an advanced look.
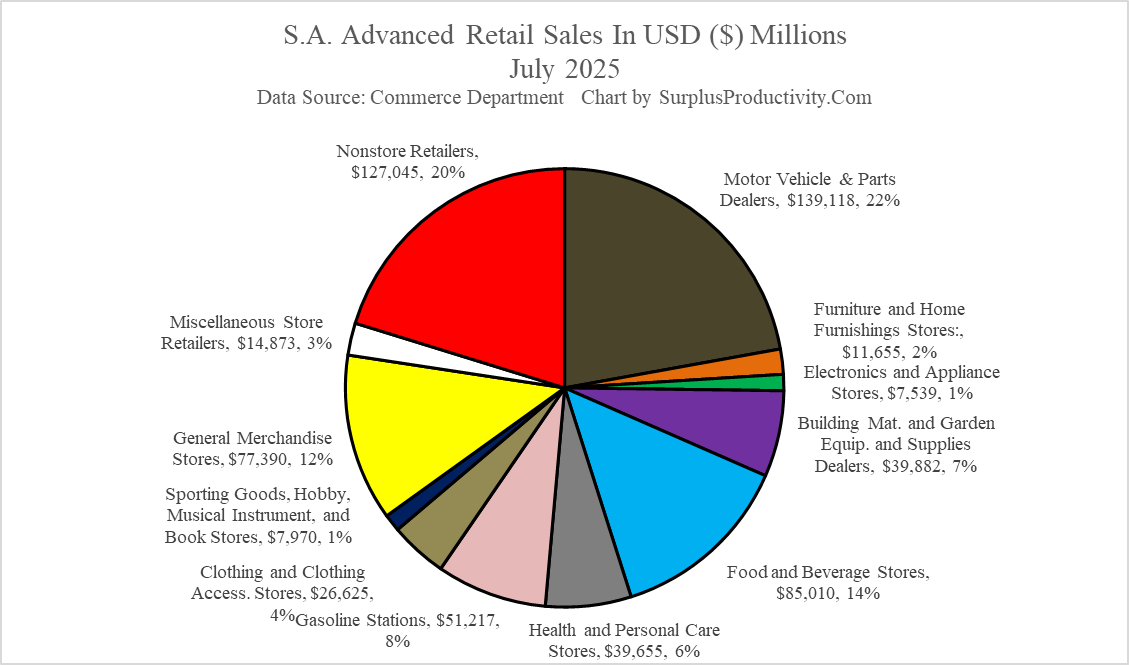
Right now, nonstore retailers carry the largest share but that hasn’t always been the case.
Keep reading with a 7-day free trial
Subscribe to SurplusProductivity.Com to keep reading this post and get 7 days of free access to the full post archives.